But Why - Explainers
The But Why project.
Goal: Explain prediction of model for specific sample - "local feature importance" Challenge: There are several definitions\options of how to explain a specific prediction. Method: Using Shapley Values definition. You can read more about it in Wikipedia. Background: Shapley values have several properties which makes them more suitable for explaining model predictions. It gives better result in experiments that are favorable among testers compared to other methods (science jornals claim that).
Shapley Values - simplified: Given a specific prediction sample and requirement to explain the prediction by its contributing variables, Shapley Values divides the contribution fairly (comes from game theory) and is unique solution For this division of contributions which answer some important properties. Each variable is given an importance score based on how the score is effected by the knowledge of this specific variable value. For example - if a variable is a copy of another variable (or deterministic function of the other variable) - it will receive the same importance as the other variable regardless of the model (the variables should contribute the same). If variable doesn't affect the score - it will get 0 importance. The sum of all variable's importance is the score. The problem is that Shapley value is hard to calculate and can only be estimated. The minimal properties for unique solution:
- Null player - If variable does't affect the score in any scenario (knowledge of the variable) - it will get 0 importance
- Symetric/Consitent/Fairness - If i,j are unknown features and in all cases when 1 of them is known the score changes the same as the other one is known - they will get the same contribution score
- Linearity - If we have 2 functions v,w and define a new function v+w to explain which sums the 2 functions - so the contribution value for each varaible in each function v,w can also be summed. Framework for experiments: The git repository is MR_Projects - mapped into $MR_ROOT/Projects/Shared/Projects
The experiment will be done on multiple model to test for robustness. All the models are on THIN, except CRC which is on MHS. The models are:
- Diabetes model
- Repository: THIN 2017
- Json to train model: $MR_ROOT/Projects/Shared/Projects/configs/But_Why/test_models/pre2d_model.json
- Train\Test samples: /server/Work/Users/Alon/But_Why/outputs/explainers_samples/diabetes
- GAN model to generate synthetic samples for shapley calculation if needed: /server/Work/Users/Alon/But_Why/outputs/GAN/pre2d_gan_model.txt
- CRC model
- Repository: MHS
- Json to train model: $MR_ROOT/Projects/Shared/Projects/configs/But_Why/test_models/crc.json
- Train\Test samples: /server/Work/Users/Alon/But_Why/outputs/explainers_samples/crc
- GAN model to generate synthetic samples for shapley calculation if needed - Not exist, need to create one
- Flu+Complications simpler model (All relevatn drugs, all relevant diagnosis, Age, Gender and 5 top lab tests features)
- Repository: NWP
- Json to train model: in flu project fo nwp. The final binary of trained model is in here: /server/Work/Users/Alon/But_Why/outputs/explainers/flu_nwp/base_model.bin
- Train\Test samples: /server/Work/Users/Alon/But_Why/outputs/explainers_samples/flu_nwp
- GAN model to generate synthetic samples for shapley calculation if needed - Not exist, need to create one
The Experiment: Experiment will be performed on each model. We will try to explain the test samples (special samples were collected for each problem - for example low hemoglobin and high score in CRC and the opposite... several examples for each model) with different explainers. Explainers are PostProcessor of ModelExplainer. We will try to explain the prediction with different configurations\method for each sample in the model. After collecting all the results we will go over the alternatives and Coby Metzger(someone else?) will score them by:
- Good
- Fair
-
Bad General comments:
-
Options to test - in blined (method changes each row randomly)
- Test 10 examples for each Explainer setting for sanity before the full experiment
- Final step to validate with someone else besides Coby (Karni?)
- Grouping
- Output - return top 10 of most contributing with abs value. - will return contribution and normalized contribution in the output (both magnitudes). will also print value of representative feature in the group (the representative will be chosen by the most important feature in the group) Selected problems:
- CRC - about 1400 features and 40 test samples
- Diabetes - about 100 features and 143 test samples - need to reduce number of samples (not need that much)
- Flu simpler - Drug, Diagnosis, Age, Gender + 7 lab features and 20 test samples
Explainer settings:
- KNN - with threshold on 5% without covariance fix
- tree without covariance fix
- tree with covariance fix
- LIME with GAN - do some test to choose the required number of masks. without covariance fix
- Shapley with GAN - do some test to choose the required number of masks. without covariance fix
- missing_shapley - retrain model with random missing values samples and use the retrained model with masks (much faster shapley, less accurate). without covariance fix total test: 6 * (40+20+143) = 1218 testIf diabetes will have less samples (for example 30) - 540 tests
The Explainers: All the different explainers are configured unders:
- KNN - coby method for KNN
- LIME_GAN - LIME Shapley with GAN
- LIME_gibbs_LightGBM - Lime Shapley with Gibb sampling of LightGBM model to estimate each variable value probability based on other variables in the Gibb sampling
- LIME_gibbs_QRF - Lime Shapley with Gibb sampling of QRF model to estimate each variable value probability based on other variables in the Gibb sampling. Faster than LightGBM but less accurate
- shapley_GAN - estimating Shapley values by sub-sampling masks from all possible masks to estimate the sum of all the masks. Uses fixed weights (because of the sampling) thatthe sum of the experiments with weights will aggregate to the expected sum over all masks (with Shapley weights). Uses GAN to generate the samples in each sampled mask experiment.
- shapley_GAN_sample_by_size - estimating Shapley values by sub-sampling masks from all possible masks to estimate the sum of all the masks. Uses fixed weights (because of the sampling) and uses sampling that is not random that the sum of the experiments with weights will aggregate to the expected sum over all masks (with Shapley weights). Uses GAN to generate the samples in each sampled mask experiment.
- shapley_gibbs_lightGBM - estimating Shapley values by sub-sampling masks from all possible masks to estimate the sum of all the masks. Uses fixed weights (because of the sampling) thatthe sum of the experiments with weights will aggregate to the expected sum over all masks (with Shapley weights). Uses Gibb sampling of LightGBM model to estimate each variable value probabilitybased on other variables in the Gibb sampling
- shapley_gibbs_QRF - estimating Shapley values by sub-sampling masks from all possible masks to estimate the sum of all the masks. Uses fixed weights (because of the sampling) thatthe sum of the experiments with weights will aggregate to the expected sum over all masks (with Shapley weights). Uses Gibb sampling of QRF model to estimate each variable value probabilitybased on other variables in the Gibb sampling. Faster than LightGBM but less accurate
- tree - Uses tree algorithm for trees
- missing_shap - learn a respond model to mimic model result on missing values
Can also add more configurations - Play with processings like grouping, covariance sum, to zero missing values and more... Need to define and close all options to test!
How to generate explain results for model:
Use the scripts in:
script args are: 1. the explainer cfg name: look for the available names above under The Explainers section. For example "tree" or "KNN" or "LIME_gibbs_QRF" 2. Run_mode - a number with 2 bits:
-
First bit if on - will run explainer to explain predictions on the test samples - will override existing results
-
Second bit if on - Will run train\adjust model - Will force readjust modelFor Examples: 0 - do nothing just convert outputs. 1 - only apply and run explainer to explain test samples. 2 - will only run adjust_model. 3- will do both
- Summary run mode flag - if zero (default argument value) will finish run after Train\Apply explainer (depend on Run_Mode). if got 1 - will create a blinded random_test with all the explainers. If got 2 - will summarize all scores for all the explainers and will create a report*
Full example for diabetes:
I have script that creates a blinded report (the first argument KNN_TH is not being used, but you must pass it. it can be either any of the possible explainers in the experiment)Now look at /server/Work/Users/Alon/But_Why/outputs/explainers/diabetes/compare_blinded.tsv Example from diabetes blinded report:
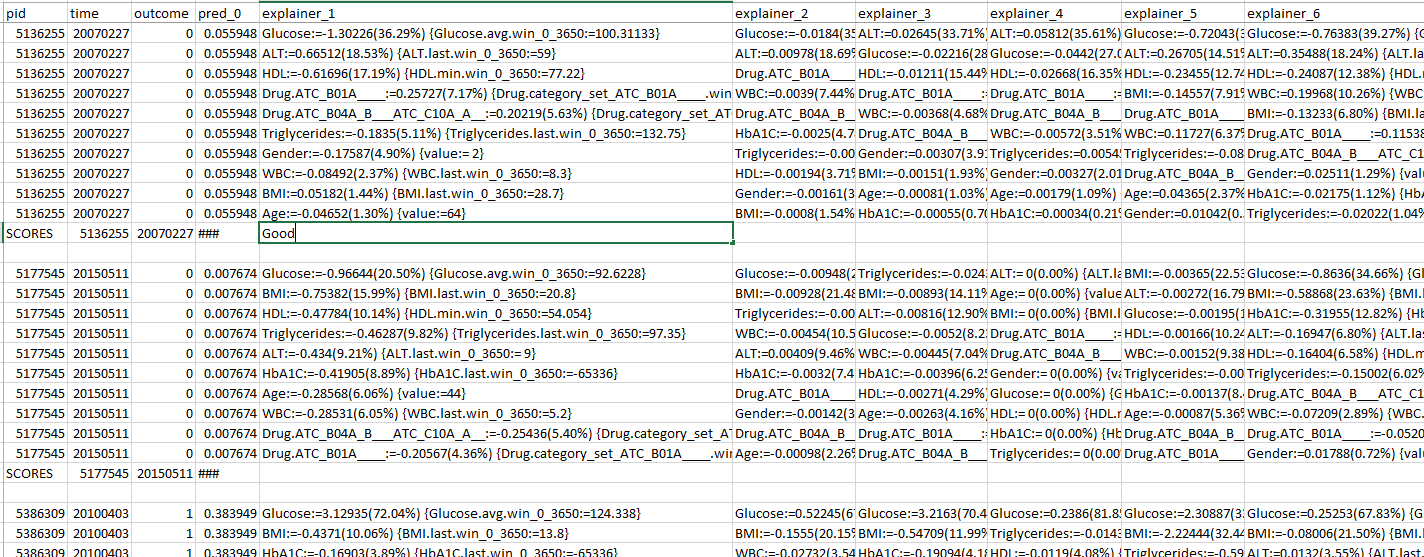 As you may see after each sample of patient+time there is a line with “SCORES” to score each explainer - wrote for example "Good" for the first explainer.
Each explainer ranks the top 10 groups of features to explain the prediction score pred_0.
Example for line 1 in explainer_1: Glucose:=-1.30226(36.29%) {Glucose.avg.win_0_3650:=100.31133} – which means the contribution of Glucose group of signals is -1.30 (pay attention to the minus sign) which means Glucose levels reduce the score.
In the brackets you may see the normalized contribution of the signal in percentage – Glucose is responsible for 36.29% of the score. Lastly, you may see the value of the most important feature in the group “Glucose.avg.win_0_3650” and the value is 100.31..
*** You need to be consistent with the scores (case insensitive), either “good”, “fair” “bad” or number, just keep the same scores (don’t use free text, if need to comment use the line below) ***
the explainer's names for each line (patient+ prediction time) is recorded in the file map.ids.tsv
Example of map.ids.tsv for each record:
As you may see after each sample of patient+time there is a line with “SCORES” to score each explainer - wrote for example "Good" for the first explainer.
Each explainer ranks the top 10 groups of features to explain the prediction score pred_0.
Example for line 1 in explainer_1: Glucose:=-1.30226(36.29%) {Glucose.avg.win_0_3650:=100.31133} – which means the contribution of Glucose group of signals is -1.30 (pay attention to the minus sign) which means Glucose levels reduce the score.
In the brackets you may see the normalized contribution of the signal in percentage – Glucose is responsible for 36.29% of the score. Lastly, you may see the value of the most important feature in the group “Glucose.avg.win_0_3650” and the value is 100.31..
*** You need to be consistent with the scores (case insensitive), either “good”, “fair” “bad” or number, just keep the same scores (don’t use free text, if need to comment use the line below) ***
the explainer's names for each line (patient+ prediction time) is recorded in the file map.ids.tsv
Example of map.ids.tsv for each record:
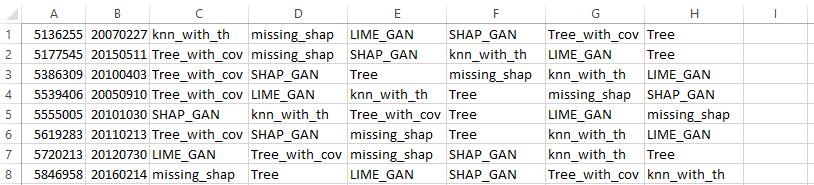 In each line we can see the order of explainers
*Macro Analysis of explainers:
Analyze each explainer results: how many Good, Fair, Bad for each model and all together.
To create summary resport run:
The summary can be found in files:
In each line we can see the order of explainers
*Macro Analysis of explainers:
Analyze each explainer results: how many Good, Fair, Bad for each model and all together.
To create summary resport run:
The summary can be found in files:
- summary.tsv - For each record (patient + prediction time) and explainer (now with the name, not blinded) will reveal Coby scores. A table for each sample records X explainer's names - the values in the cells are Coby's scores
- summary.sum.tsv - A summary for each explainer name and each score how mnay times it happened. Conclude into conclusion.