Test 1 - Generate Repository
Overview The main goal of this 'test' is to load the inputs from the AlgoAnalyzer into repository for evaluation. Next, tests that are part of the ETL are performed. Parameters (see env.sh) Inputs:
- WORK_DIR - output folder path to process and load the repository
-
SILENCE_RUN_INPUT_FILES_PATH - The path to the input data files in "file_api" format Outputs:
-
Repository in directory ${WORK_DIR}/rep
-
ETL tests results in ${WORK_DIR}/ETL (see also ETL_WORK_DIR) Test Results Review Full ETL log including tests - WORK_DIR/01.generate_repository.log The following is a recipe for checking the log. a. high level review of signal values distribution See example:
Output would be list of features where some percentiles are far from the reference: q - is the quantile, value_0 - is the quantile in current dataset, reference - the quantile in the reference dataset. ratio1 = value_0 / reference, ratio2 = 1 / ratio1, ratio = max(ratio1, ratio2). What may be the reason? -
If unit transformation is wrong, we expect several 'issues' for the same signal with different percentiles (q) ,like in the example above => This would be a RED FLAG.
- If we see 'issues' here and there, we still need to understand them. For instance:
- Are 0 allowed? if the answer is not the same for the two datasets, then we are likely to see alerts on low values
- Are kid allowed? different age range in the reference compared to the dataset may affect the range ... please add here more possible reasons that you happened to meet/explore b. Deep dive into important features The important features of this model are defined in env.sh For every SIGNAL the detailed output includes:
- A specific test log in ETL/outputs/test.$SIGNAL.log and logs from processing instructions (if were, for example, dropping lines without dates, before testing) in ETL/signal_processings_log/$SIGNAL.log
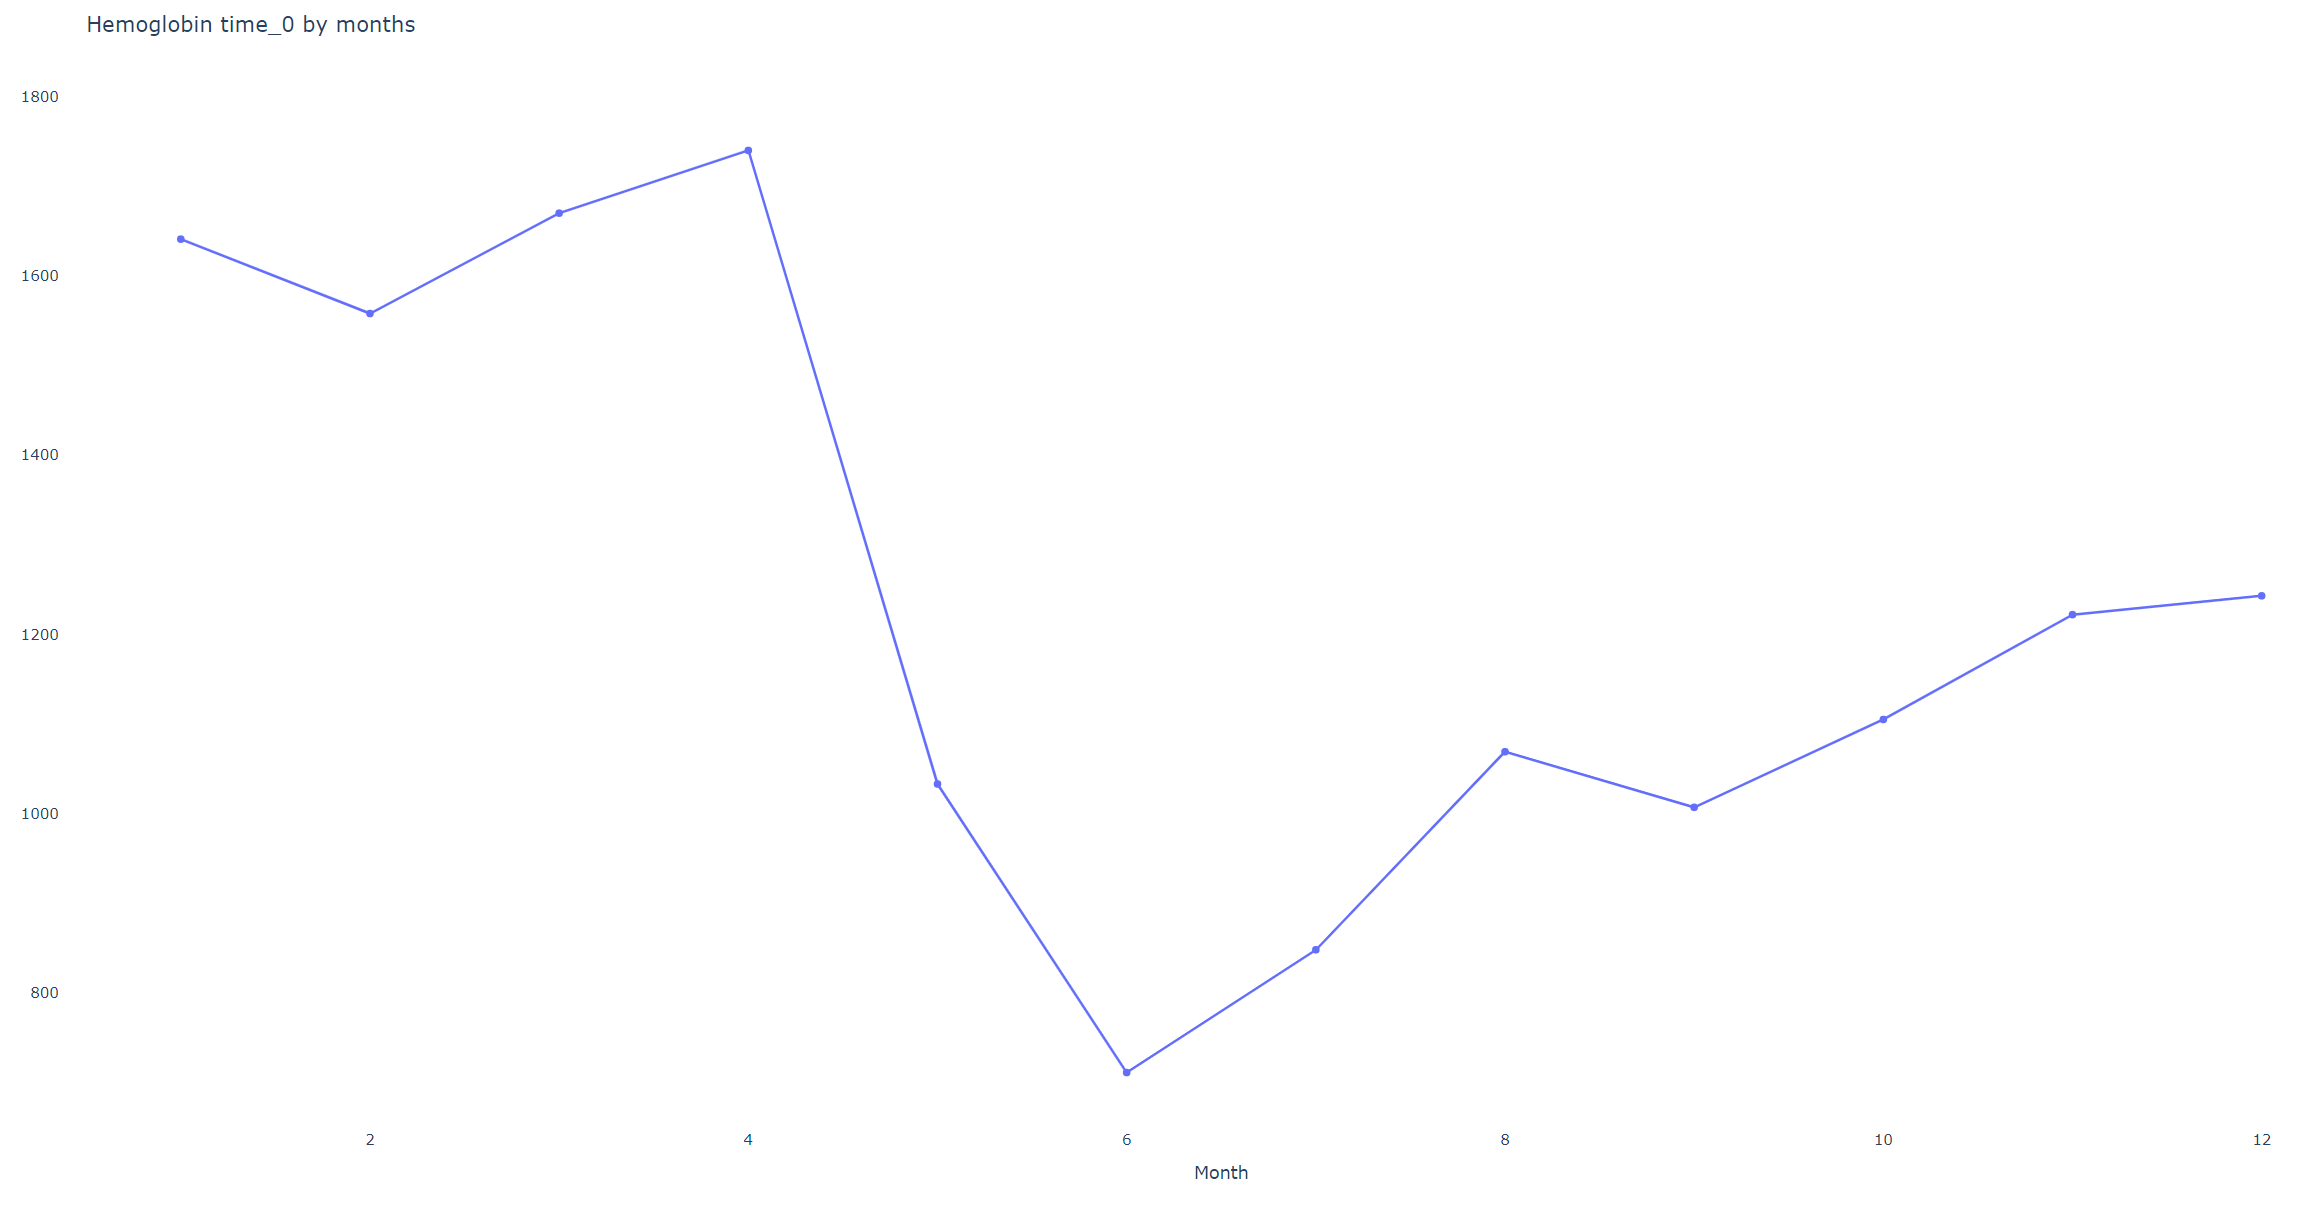
- Distribution of day, month, year and value, in ETL/signal_processings_log/SIGNAL/batches/, If we have more than 1 batch, and aggregated report will appear in ETL/signal_processings_log/SIGNAL It is recommended to manually check the logs and charts of all important features. What we might see?
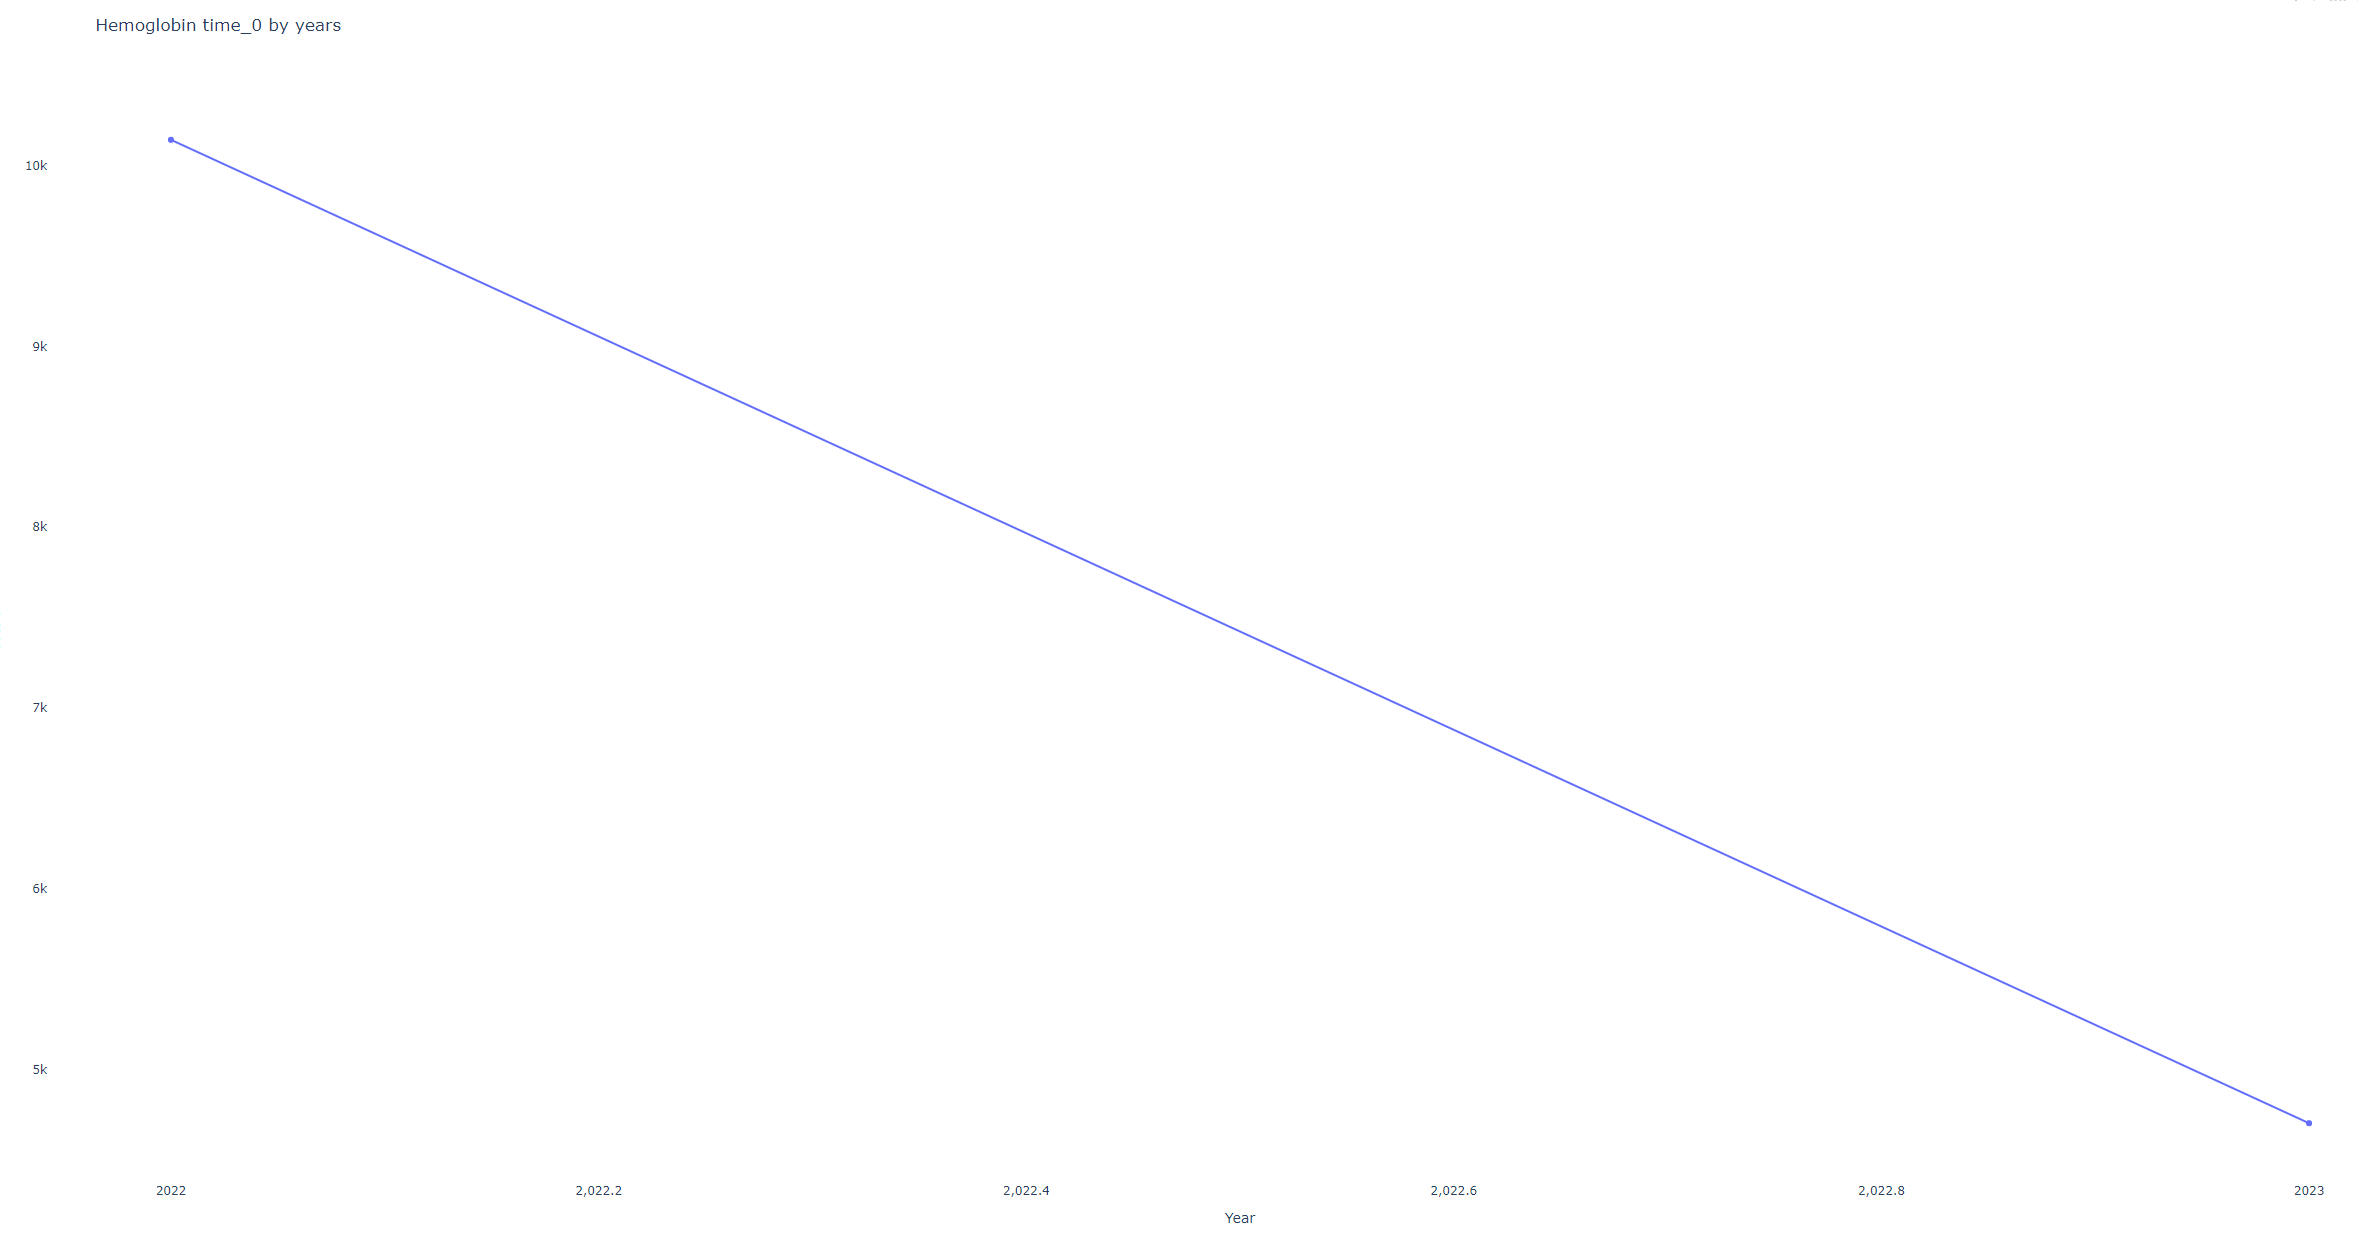
- Example 1:The following graphs are monthly distribution of Hemoglobin samples, from dataset prepared in the middle of 2023. The monthly samples looks suspicious, however from the yearly graph we see that samples are just since last year. Hence, more samples on the first months of the year is expected.
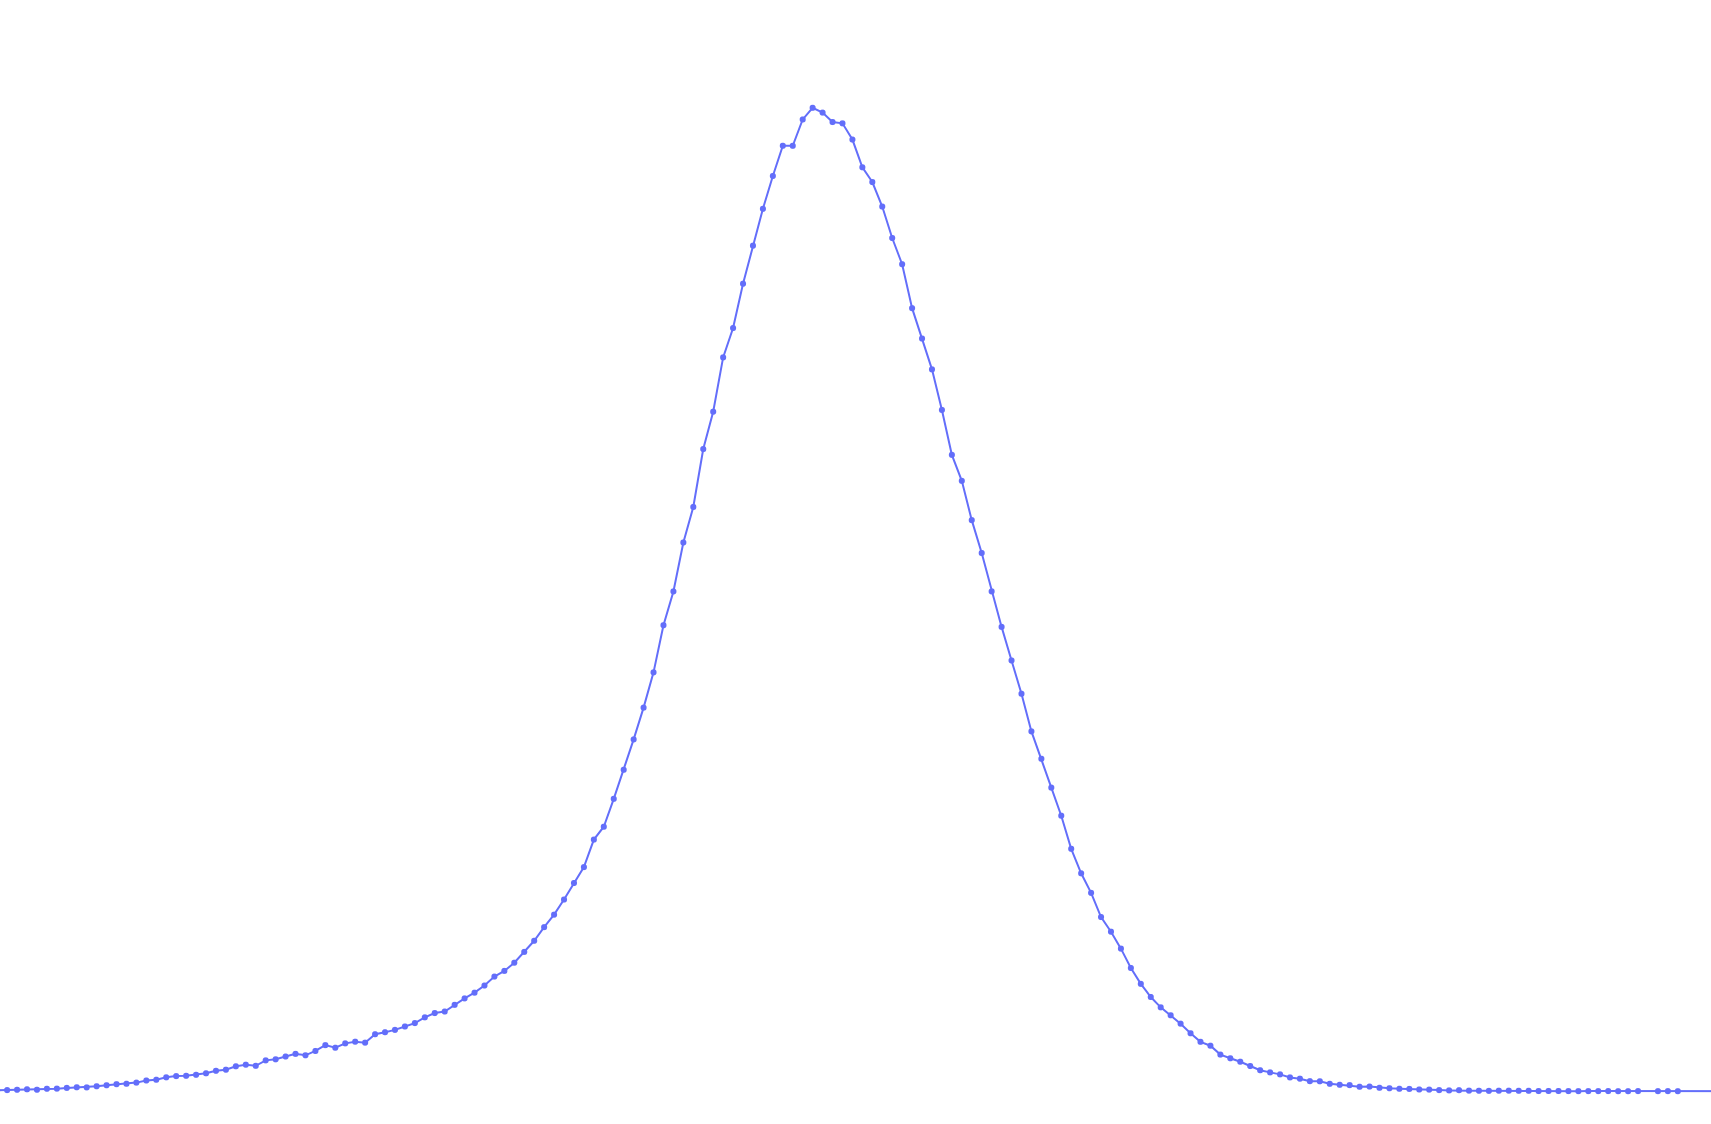
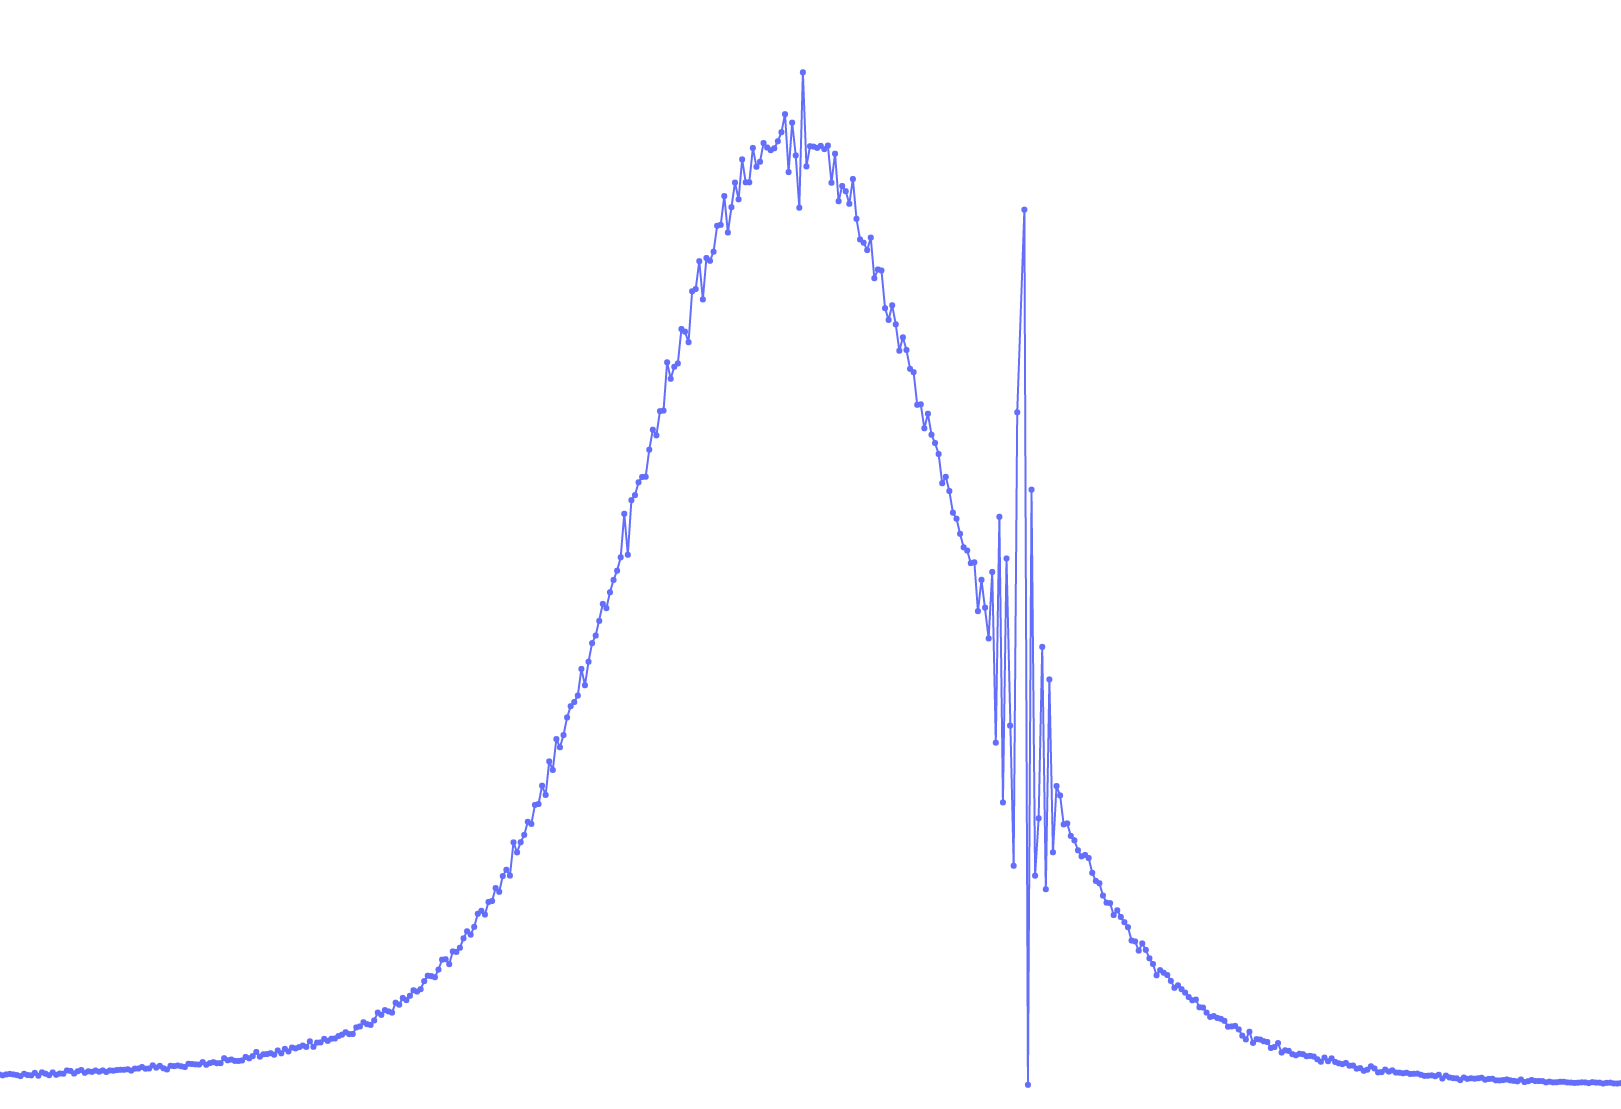
- Example 2:On the right we see normal distribution of a lab measurement.On the left we unclear 'vibrations'. It is not likely to affect the model, but one might check with the dataset owner the reason, to make sure it does not hide a bigger problem.
 **
** - ... please add here examples/issues that you happened to meet/explore in the charts and/or detailed logs