Test 10 - Compare Important Feature
Purpose
Compare distributions of the model's most important features between the current (test) dataset and the reference dataset. This test computes summary statistics, missing-value rates, KLD-based similarity measures, and produces per-feature histograms split by gender.
Required Inputs
From configs/env.sh and the test invocation environment:
WORK_DIR: working folder containing compare artifacts and matricesCMP_FEATURE_RES: comma-separated list of feature identifiers with resolution, format: FeatureName:resolution (e.g. "Hemoglobin:0.1,Age:1")- The test depends on Test 05; expected files are:
${WORK_DIR}/compare/rep_propensity.matrix${WORK_DIR}/compare/rep_propensity_non_norm.matrix
How to Run
From your TestKit folder, execute:
After run, check ${WORK_DIR} and ${WORK_DIR}/compare for generated files.
What This Test Does
- Loads
${WORK_DIR}/compare/rep_propensity.matrixand${WORK_DIR}/compare/rep_propensity_non_norm.matrixinto pandas DataFrames. - Filters the non-normalized frame to positive outcome rows (used to compute missing-value-before-normalization stats).
- Parses
CMP_FEATURE_RESinto two aligned lists: feature names (normalized to remove category prefixes likeICD9_CODE:) and numeric resolution values. - For each feature in the list:
- Matches the exact column in the matrix (error if ambiguous or missing)
- Computes missing-value rates for test (outcome==0) and for positive cases using
-65336as the sentinel missing value - Applies rounding/bucketing according to the provided resolution and computes grouped percentage distributions separately for:
- Test_Run:Males (outcome>0 & Gender==1)
- Test_Run:Females (outcome>0 & Gender==2)
- Reference:Males (outcome==0 & Gender==1)
- Reference:Females (outcome==0 & Gender==2)
- Writes per-feature bar/histogram HTML into
${WORK_DIR}/features_graphs/<Feature>.html - Computes a KLD score comparing positive vs reference distributions using
calc_kldand prints KLD, KLD-to-uniform, and entropy - Appends feature-level statistics into
${WORK_DIR}/features_stats.tsvwith columns: Feature, Reference_Mean, Reference_Std, Reference_Missing_value_percent, TestRun_Mean, TestRun_Std, TestRun_Missing_value_percent, TestRun_Missing_value_before_norm
Output Location
${WORK_DIR}/features_graphs/— one HTML plot per feature (bar charts split by gender and dataset)${WORK_DIR}/features_stats.tsv— TSV summary of means, stds and missing rates- Standard output / test log (e.g.,
${WORK_DIR}/10.analyze_features.log) containing per-feature KLD printouts and summary lines
How to Interpret Results
- Use
features_stats.tsvto quickly spot differences in means, spread, and missing-value rates between the test and the reference. - Use the HTML graphs in
${WORK_DIR}/features_graphs/to visually compare the binned distributions by gender and dataset. - KLD values printed by the script quantify distributional divergence between positive cases and reference; higher KLD indicates larger distributional shift. Compare KLD across features to prioritize investigation.
Interpretation advice:
- Large mean or distribution differences together with large KLDs imply features where the test dataset deviates from the reference and that might explain model performance differences.
- High missing-value rates in the test (or large change in missing rate vs reference) may indicate data collection or ETL problems that need fixing before model deployment.
Troubleshooting
- "Found X features for Y" NameError: If the script raises this, the feature name from
CMP_FEATURE_RESmatched multiple columns or none. CheckCMP_FEATURE_RESspelling and column names in${WORK_DIR}/compare/rep_propensity.matrix. - Missing
rep_propensityfiles: ensure Test 05 completed successfully and produced${WORK_DIR}/compare/rep_propensity.matrixand_non_norm.matrix. - Plot HTMLs referencing
plotly.jsnot displaying: verify${WORK_DIR}/features_graphscontains the HTML files and that../js/plotly.jsis present relative to the generated path. If Plotly is not available, copyplotly.jsinto${WORK_DIR}/compare/js/or change the path in the script.
Example output snippets
1) features_stats.tsv example:

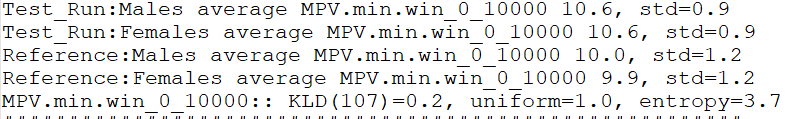
2) Log file 10.analyze_features.log
3) Histogram Graph of features in ${WORK_DIR}/features_graphs
Notes and Implementation Details
- The resolution value controls binning: the script rounds values to the nearest multiple of the resolution before grouping.
- The script writes percentages (not raw counts) into the graphs and normalizes group counts to percentages so we can compare current dataset to reference.
Test Results Review
Primary files to inspect after running this test:
${WORK_DIR}/features_graphs/(HTML per-feature plots)${WORK_DIR}/features_stats.tsv- Test runner log capturing stdout for KLD lines