Test 01 - Generate Repository
Purpose
Load input data from the AlgoAnalyzer into a repository for evaluation. This step prepares the dataset for further ETL tests and model validation.
Required Inputs
From configs/env.sh:
WORK_DIR: Output folder path to process and load the repositorySILENCE_RUN_INPUT_FILES_PATH: Path to the input data files in "file_api" format
How to Run
From your TestKit folder, execute:
Check the output repository for correct data loading.
What This Test Does
This script loads the new dataset into a structured repository, checks data integrity, and prepares files for further analysis. The repository is the foundation for all subsequent validation steps.
Output Location
- Processed dataset:
${WORK_DIR}/rep - ETL log files:
${WORK_DIR}/ETL
How to Interpret Results
ETL test results are found in ${WORK_DIR}/ETL. For more details, see ETL_WORK_DIR.
Test Results Review
The main ETL log is ${WORK_DIR}/01.generate_repository.log. Use the following approach to review the log:
a. High-level review of signal value distributions and sources
Example output:
In this example, Hemoglobin data comes from four sources, but only two are large enough for analysis. The first source uses unit g/L, the second g/l. A small KLD value (<< 1) means the source's value distribution is similar to the overall Hemoglobin distribution. You can verify this by reviewing graphs in ${WORK_DIR}/ETL/outputs/Hemoglobin, but if the numbers are very small, further review may not be necessary.
Lines starting with "There are issues with" and the following tables highlight discrepancies:
q: Quantile being comparedvalue_0: Quantile in current datasetreference: Quantile in reference datasetratio1: value_0 / referenceratio2: 1 / ratio1ratio: max(ratio1, ratio2)
Large ratios (e.g., factor of 10) may indicate mismatched units. The log may suggest how to fix units, such as converting from g/L or g/l to the expected g/dL (as described in the AlgoMarker), and recommend multiplying by 10.
Important: If there are mismatches in the input, loading will not fail. Warnings will appear in the log, and it is your responsibility to review and ensure the data is correct.
b. Deep dive into important features
Important features for the model are defined in configs/env.sh. For each SIGNAL, detailed outputs include:
- Specific test log:
ETL/outputs/test.$SIGNAL.log - Processing logs (e.g., dropped lines):
ETL/signal_processings_log/$SIGNAL.log - Distribution of day, month, year, and value:
ETL/signal_processings_log/SIGNAL/batches/- If there are multiple batches, an aggregated report appears in
ETL/signal_processings_log/SIGNAL
- If there are multiple batches, an aggregated report appears in
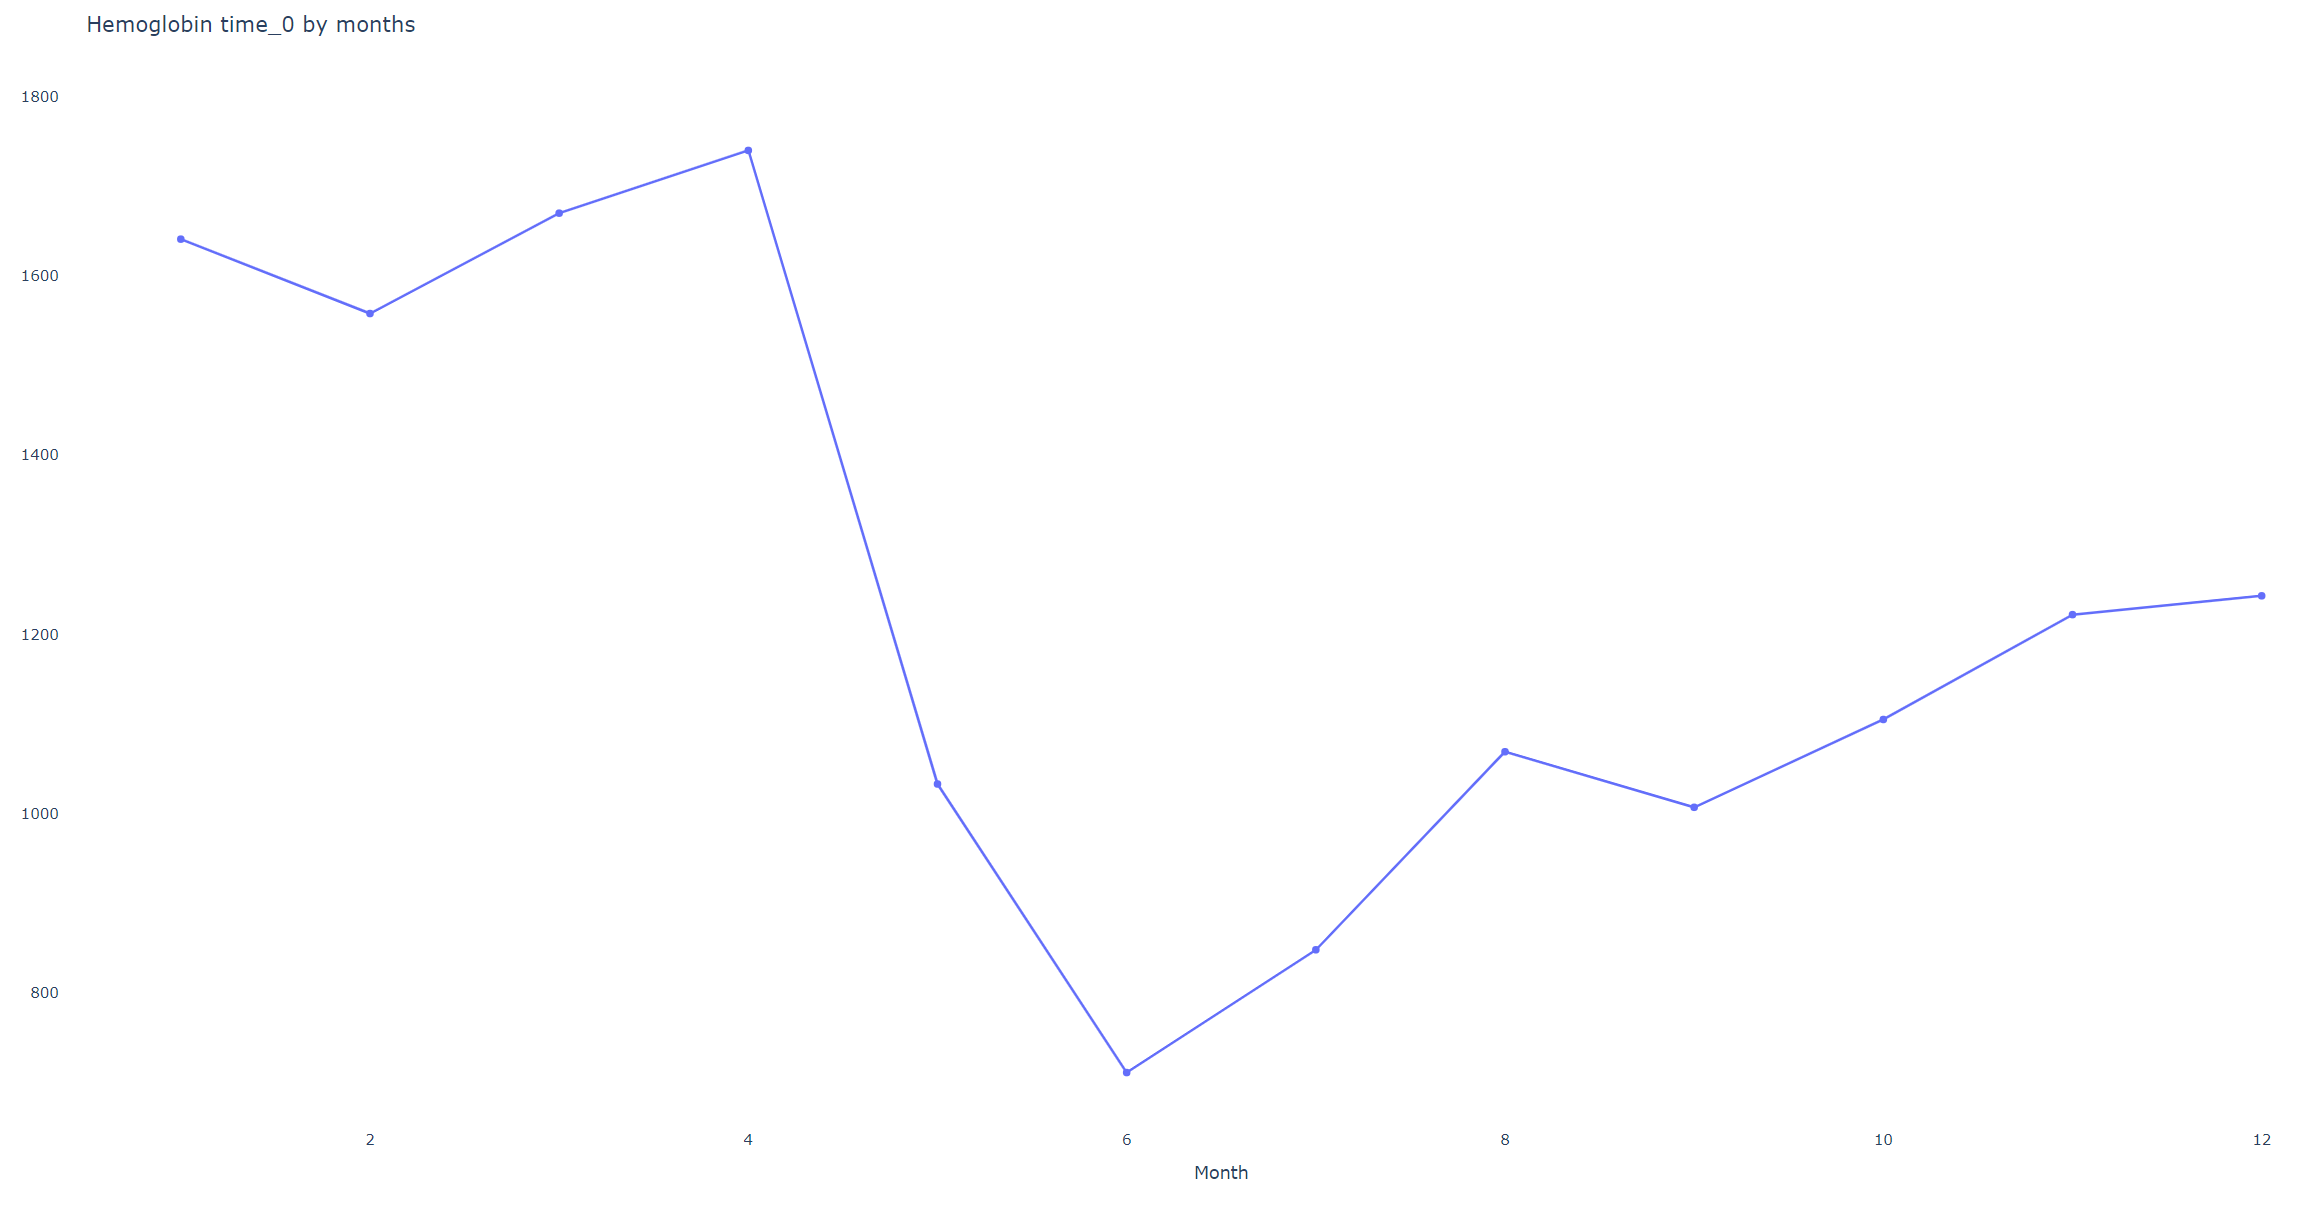
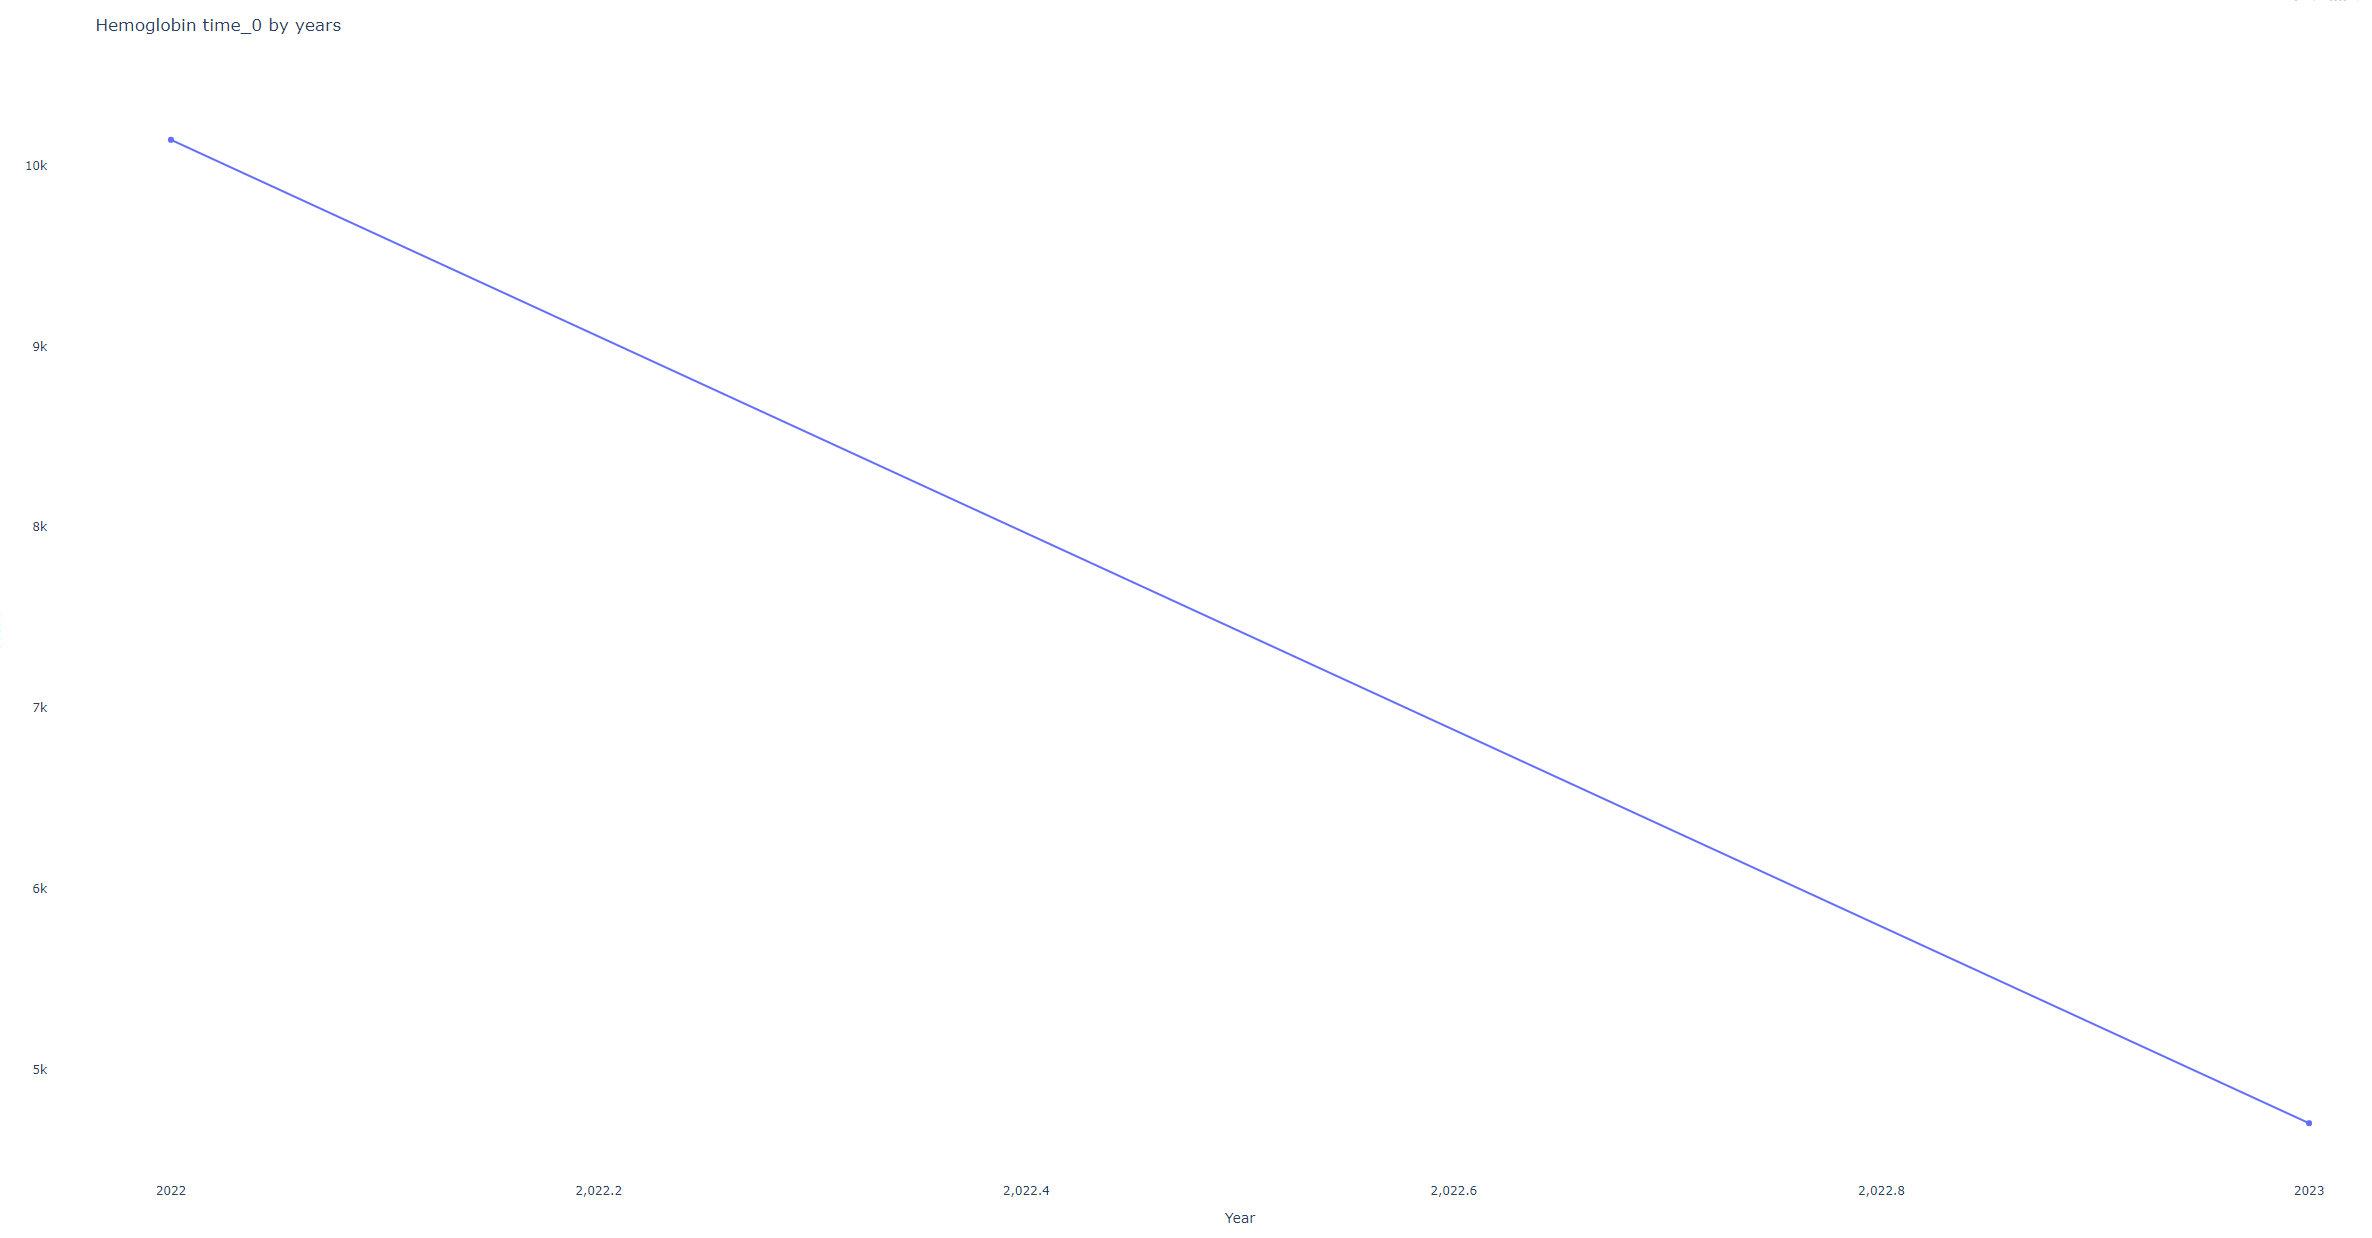
It is recommended to manually check logs and charts for all important features. For example:
- Example 1: Monthly distribution of Hemoglobin samples from a dataset prepared in mid-2023. Monthly samples may look suspicious, but the yearly graph shows samples are only from the last year, so more samples in early months are expected.
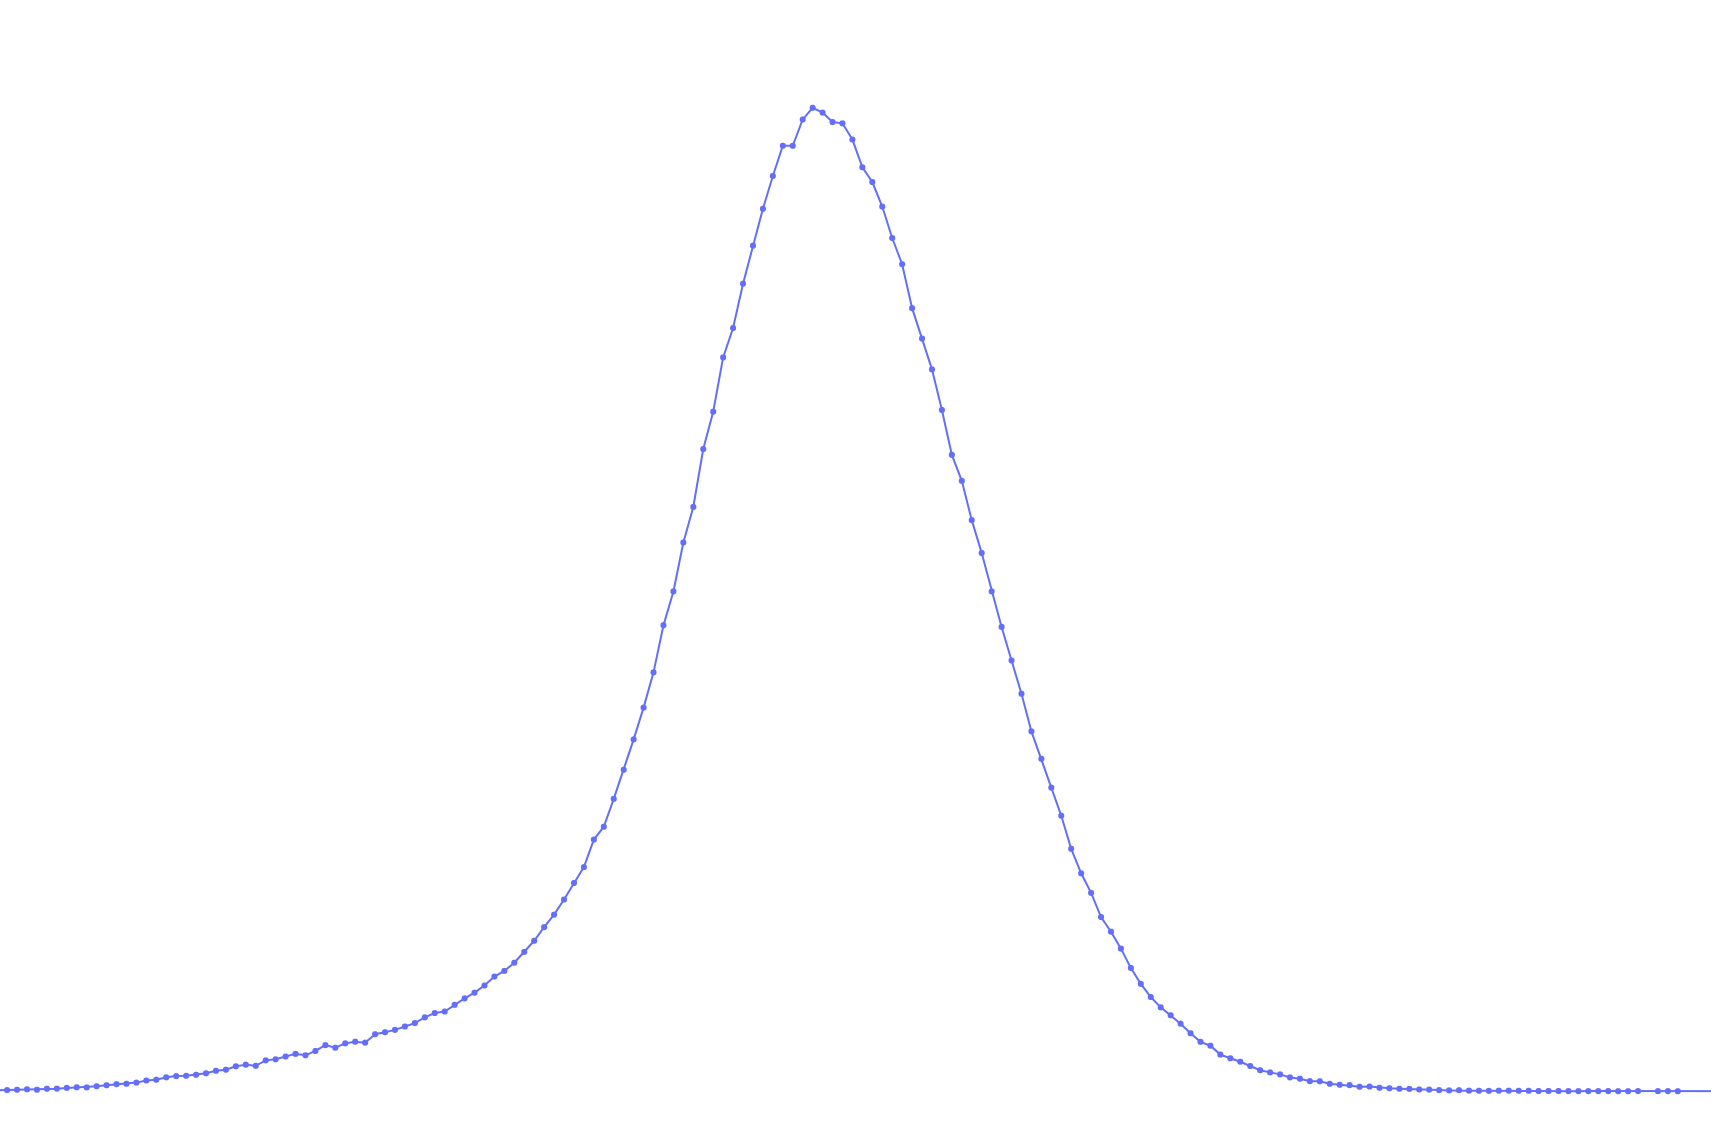
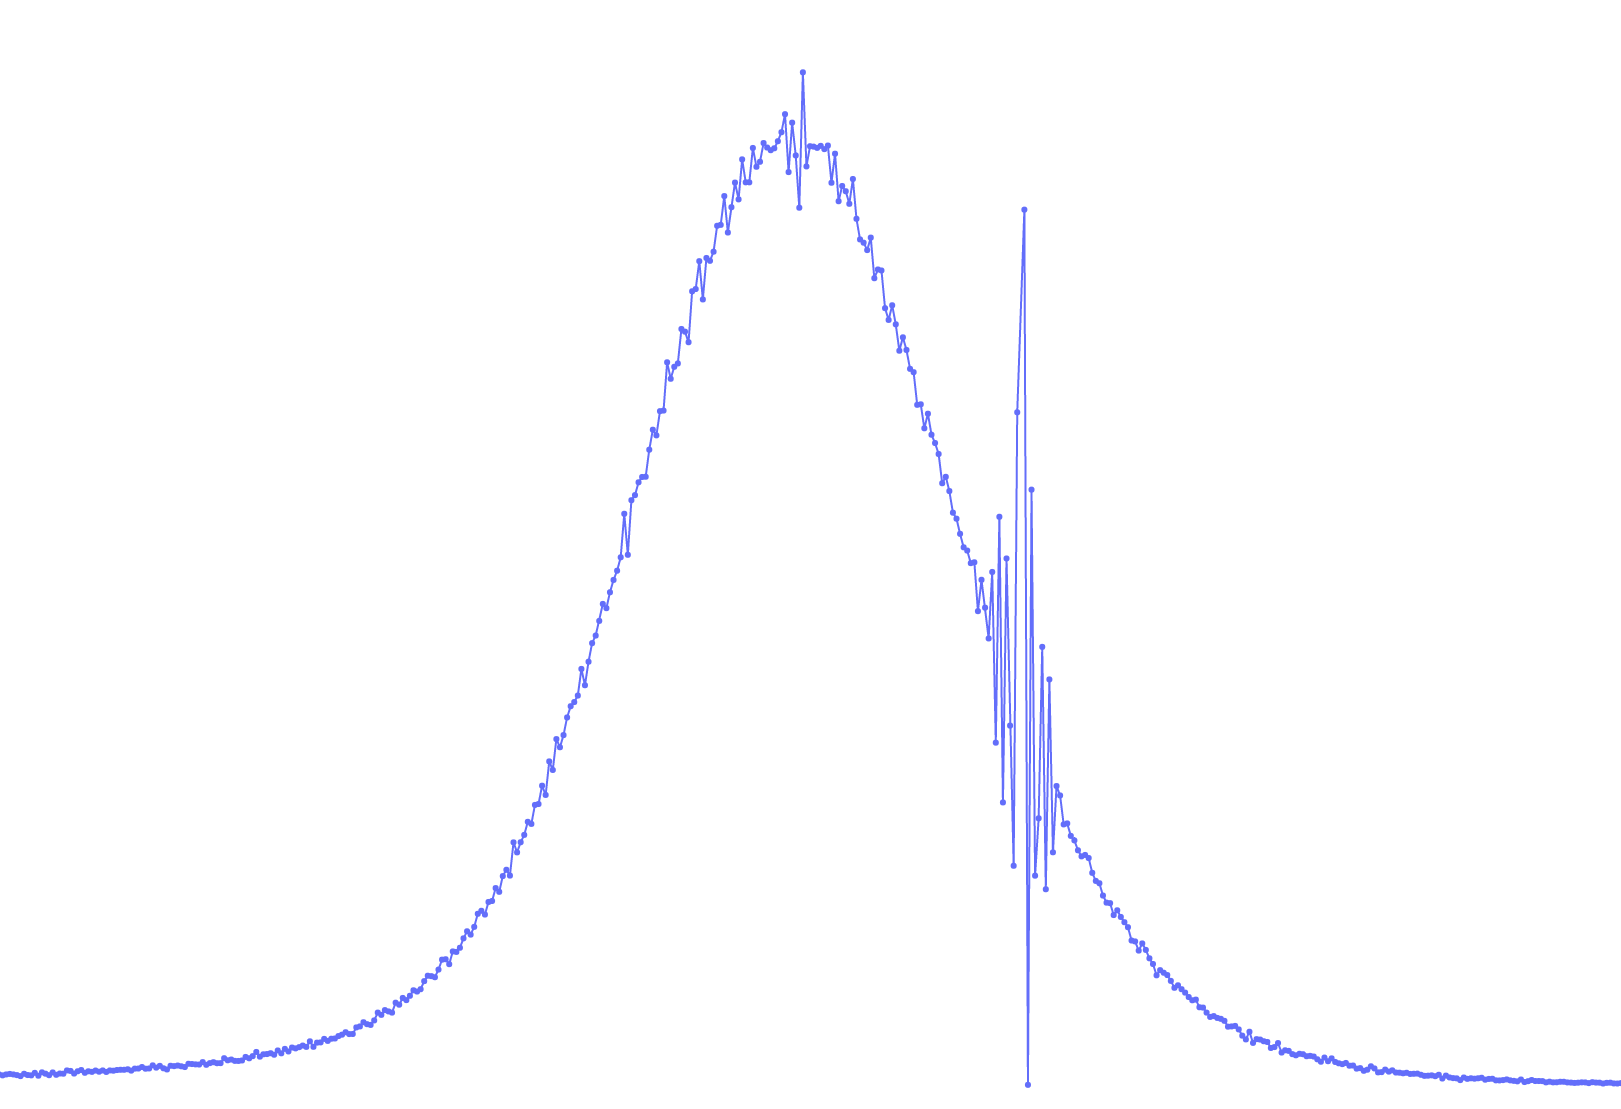
- Example 2: On the right, a normal distribution of a lab measurement. On the left, unclear 'vibrations'. This may not affect the model, but you should check with the dataset owner to ensure it does not hide a larger issue.