Test 08 - Sex Ratio
Purpose
Assess sex balance (male/female ratio) among flagged/high-score subjects and compare the test run to the reference dataset across score cutoffs. This detects potential sex-based disparities in model outputs.
Required Inputs
From configs/env.sh and the test invocation environment:
WORK_DIR: Working directory containing compare artifacts generated by Tests 05 and 06SCORE_MIN_RANGE,SCORE_MAX_RANGE: Numeric bounds (0..1) specifying the score range to inspect (the script steps by 0.01 internally)- The test depends on Tests 05 and 06 and expects the following files to exist:
${WORK_DIR}/compare/rep_propensity_non_norm.matrix${WORK_DIR}/compare/rep_propensity.matrix${WORK_DIR}/compare/3.test_cohort.preds${WORK_DIR}/compare/reference.preds
How to Run
From your TestKit folder, execute:
What This Test Does
- Loads the propensity matrices generated by Test 05 and prediction files generated by Test 06
- Joins the propensity rows with sample IDs and then with model predictions so every sample has
pred_0(score) andGenderfields - Builds a list of score cutoffs between
SCORE_MIN_RANGEandSCORE_MAX_RANGEstepping by 0.01 - For each cutoff calculates:
flagged_males: number of males in the test set withpred_0>= cutofftotal_mark: total number of flagged subjects in the test set at that cutoffref_fl_males: number of males in the reference set flagged at that cutoffref_tot_marked: total number of flagged subjects in the reference set at that cutoff- Prints the male ratio (percentage) for test and reference and the total flagged counts and rates
The script prints the summary lines to stdout (captured by the test runner logs).
Output Location
- Primary printed output: test runner log (e.g.,
${WORK_DIR}/08.sex_ratio.log) containing per-cutoff sex-ratio summaries - Source tables examined:
${WORK_DIR}/compare/rep_propensity_non_norm.matrix,${WORK_DIR}/compare/rep_propensity.matrix,${WORK_DIR}/compare/3.test_cohort.preds,${WORK_DIR}/compare/reference.preds
How to Interpret Results
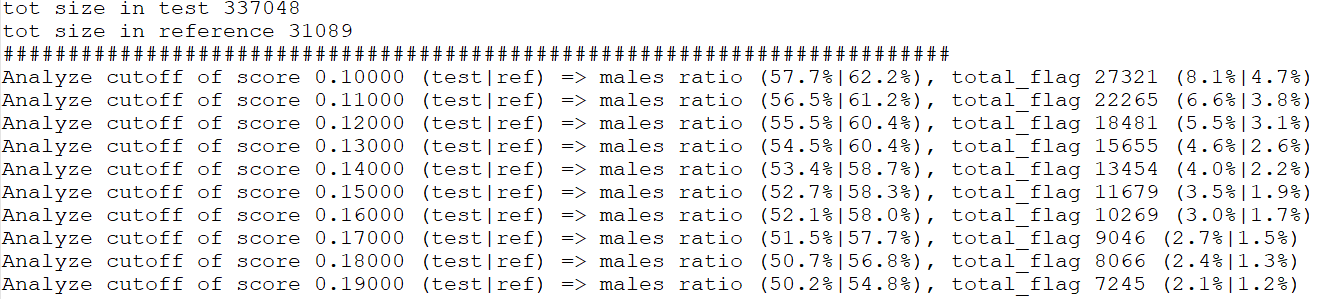
- For each score cutoff, the script prints the male ratio in the flagged subset for Test_Run vs Reference and the total number flagged (absolute and percentage of the dataset).
- A decreasing male ratio with increasing cutoff is expected if higher scores are less common in males for this model; the opposite trend may indicate bias.
- Differences between Test_Run and Reference male ratios indicate either demographic differences (population sex skew) - follow up by checking Age and other covariates.
Example output line
This means at cutoff 0.25, 60% of flagged subjects are male in the test set vs 55% in the reference; 200 subjects flagged in the test set representing 5% of the test population while the reference had 4% flagged.
Full example:
Notes and Implementation Details
- It raises an error if joins fail unexpectedly (indicates missing IDs or mismatched data). Ensure previous tests completed successfully and created the expected files.
Troubleshooting
- Missing files or join mismatches: verify Tests 05 and 06 completed successfully and that the listed source files exist and have consistent IDs.
- If results look surprising, inspect the underlying
Genderandpred_0columns in${WORK_DIR}/compare/3.test_cohort.predsand${WORK_DIR}/compare/reference.predsto ensure gender coding (e.g.,Gender==1for males) and score scaling are as expected.
Test Results Review
Primary items to inspect after running this test:
- The sex ratio summary in the test runner log (e.g.,
${WORK_DIR}/08.sex_ratio.log) ${WORK_DIR}/compare/3.test_cohort.predsand${WORK_DIR}/compare/reference.preds${WORK_DIR}/compare/rep_propensity.matrixandrep_propensity_non_norm.matrix(for linkage and sample selection details)